
Automated financial reporting is the end-to-end use of software to collect data from multiple source systems, apply consistent business rules, and produce governed, audit-ready reports without manual intervention. It replaces the familiar grind of exporting CSVs, refreshing spreadsheet formulas, and chasing colleagues for updated figures. Finance teams that adopt it reduce process costs by 35–46% and reclaim up to 40% of their working time. That is not a marginal gain. It is the difference between a finance function that reports on the past and one that shapes the future.
What is automated financial reporting, and how does it differ from manual processes?
Automated financial reporting is the industry term for software-driven report production that removes human assembly from the workflow. Manual reporting, by contrast, relies on finance professionals to extract data, paste it into spreadsheets, apply formulas, and format outputs before distributing them. Each of those steps introduces the risk of error, version conflict, and delay.
The core distinction is governance. A manual process produces a report that reflects whoever last touched the file. An automated process applies the same business rules every time, from the same source data, producing outputs that are consistent and traceable. That consistency is what makes automated reports trustworthy enough to put in front of a board or an auditor without a last-minute sense of dread.

Real-time bookkeeping feeds directly into this model. When your general ledger updates continuously, automated reporting can pull live figures rather than month-end snapshots. The result is financial visibility that matches the speed at which your business actually moves.
How does automated financial reporting work from data collection to delivery?
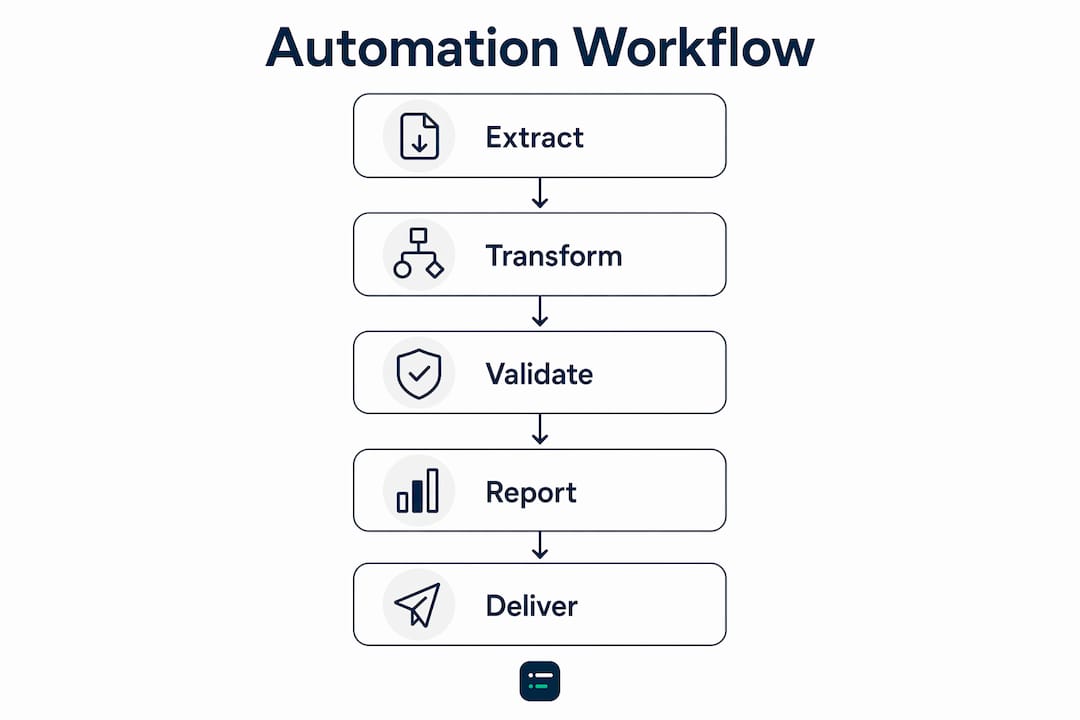
The automation pipeline has five distinct stages. Understanding each one helps you spot where your current process still has manual gaps.
- Data extraction. The system connects directly to your ERP, general ledger, CRM, billing platform, and banking feeds. It pulls data on a defined schedule or in real time, with no manual export required.
- Transformation and business rule application. Predefined rules handle currency conversion, revenue recognition, intercompany eliminations, and cost centre allocations. The rules run the same way every time, regardless of who is on the team that week.
- Validation and consolidation. The system checks for anomalies, reconciles figures across entities or currencies, and flags discrepancies before they reach a report. This is where data integrity issues are caught rather than published.
- Report generation. Validated data flows into formatted outputs: PDFs, PowerPoint decks, Excel workbooks, or live dashboards. The formatting is governed, meaning the layout, branding, and commentary structure are locked to a template.
- Distribution. Reports are sent automatically by email, posted to a shared dashboard, or pushed to communication tools. Access controls determine who sees what, and an audit trail records every delivery.
True automation covers all five stages. A dashboard that refreshes when you click a button is not automated reporting. It is a visualisation tool with a manual trigger.
Pro Tip: Map your current reporting process against these five stages before selecting any software. The stage where you still touch a spreadsheet is the stage that will cause your next reporting crisis.
What are the key benefits of automated financial reporting?
The efficiency numbers are striking, but the strategic benefits matter more in the long run.
Finance teams that automate reclaim an estimated 36–60 days per year previously spent on manual report assembly. That time does not disappear. It shifts to analysis, commentary, and stakeholder engagement. The finance function stops being a data factory and starts being an advisory service.
The specific benefits break down as follows:
- Accuracy. Automated rules eliminate broken formulas, copy-paste errors, and version conflicts. The same logic applies to every report, every period.
- Compliance and audit readiness. Controlled access and consistent business rule application mean your reports can withstand scrutiny. Auditors get a clear trail rather than a folder of spreadsheet versions.
- Faster close cycles. Automation compresses the time between period end and report delivery. Finance teams that previously closed in ten days routinely reach five or fewer after full automation.
- Real-time visibility. Automation delivers real-time metrics to executives, enabling immediate detection of negative trends rather than waiting for the next month-end pack.
- Stakeholder trust. When everyone in the business pulls figures from the same governed source, the debates about whose numbers are correct stop. That alone saves hours of unproductive meeting time.
"Automation rebuilds trust in financial data by consistently applying business rules and removing spreadsheet errors, which helps end repeated stakeholder debates." Savant Labs
The benefits of automated reporting compound over time. A finance team that spends less time assembling data spends more time explaining performance. That shift changes how leadership perceives the finance function, and it changes the quality of decisions the business makes.
What misconceptions and pitfalls should finance professionals avoid?
The most common misconception is that connecting a dashboarding tool to an ERP constitutes full automation. It does not. Simply connecting dashboards to ERP is insufficient for true automation, which requires a complete pipeline managing extraction, transformation, and governed output without manual steps.
Three pitfalls account for most failed implementations:
- Skipping the last mile. The most labour-intensive step is turning validated data into presentation-ready reports such as board slides or PDFs. Many teams automate data extraction but still manually format the final deliverable. That gap defeats much of the purpose.
- Automating dirty data. Automating on unclean or inconsistent data propagates errors at scale. If your chart of accounts has inconsistencies or your cost centres are labelled differently across entities, automation will publish those inconsistencies faster and more widely than any manual process ever did.
- Underestimating cultural change. Finance professionals who have spent years assembling reports often feel their expertise is being removed rather than redirected. The transition from data wrangling to performance explanation requires deliberate change management, not just a software rollout.
Pro Tip: Before automating anything, standardise your Master Data Management. Lock down your chart of accounts, cost centre naming conventions, and entity hierarchy. Automation built on clean data is an asset. Automation built on messy data is a liability.
Mid-sized companies with 50–500 employees should prioritise automation before expanding their finance headcount. Hiring more analysts to manage a broken manual process is expensive and temporary. Fixing the process scales permanently.
How can businesses implement automated financial reporting effectively?
Implementation succeeds when it follows a clear sequence rather than a big-bang rollout.
- Clean your data first. Standardise your chart of accounts, cost centre codes, and entity structure across every source system. This is unglamorous work, but it determines whether your automated reports are trustworthy.
- Connect your source systems. Link your ERP, general ledger, CRM, and banking feeds to your reporting platform. Prioritise systems that hold the highest-volume, highest-frequency data.
- Define your business rules centrally. Currency conversion rates, revenue recognition policies, and intercompany elimination logic should live in one place. Every report draws from the same ruleset.
- Automate the full pipeline, including final formatting. Do not stop at data extraction. Configure your platform to generate formatted PDFs, slide decks, or dashboard views automatically. This is where the accounting workflow templates you build today pay dividends for years.
- Set up governed distribution. Define who receives which reports, on what schedule, and with what level of access. Build in version control and an audit trail from day one.
- Monitor and refine. Review automated outputs against manual spot-checks for the first three months. Adjust business rules where outputs diverge from expectations.
The table below summarises the implementation stages and their primary focus areas.
| Stage | Primary focus | Common risk |
|---|---|---|
| Data cleansing | Master Data Management | Skipping due to time pressure |
| System connection | ERP, GL, CRM, banking feeds | Incomplete integrations |
| Business rule definition | Currency, recognition, eliminations | Rules stored in multiple places |
| Pipeline completion | Formatted report generation | Stopping at data extraction |
| Distribution setup | Access controls, audit trail | Open access with no governance |
| Monitoring | Spot-checks and rule refinement | Assuming automation is self-correcting |
Finance teams that follow this sequence consistently reach full automation within one to two reporting cycles. Those that skip data cleansing or final-mile formatting typically restart the project within a year.
Key takeaways
Automated financial reporting delivers its full value only when the entire pipeline, from data extraction to formatted report delivery, runs without manual intervention.
| Point | Details |
|---|---|
| Full pipeline automation | True automation covers extraction, transformation, validation, formatting, and distribution. |
| Data quality first | Standardise Master Data Management before automating to prevent errors scaling across reports. |
| Last-mile formatting | Automating final report formatting is the hardest and most impactful stage. |
| Strategic time reclaimed | Finance teams reclaim 36–60 days per year, shifting focus from assembly to analysis. |
| Governance is non-negotiable | Controlled access and consistent business rules are what make automated reports audit-ready. |
The shift I think most finance teams underestimate
The efficiency gains from automated financial reporting are real and well-documented. What I find more interesting, and more consequential, is what happens to the finance function once those gains materialise.
Finance professionals who spent years building reports often underestimate how much of their perceived expertise was actually process knowledge. They knew which cells to update, which tabs to hide, and which formulas broke when the ERP exported in a different format. Automation removes all of that. The question it leaves behind is sharper: can you explain what the numbers mean and what the business should do about them?
That is not a comfortable question for everyone. I have seen teams adopt excellent automation platforms and then spend the reclaimed time on lower-priority tasks because nobody redefined what the finance function was now for. The technology is the easy part. The harder part is deciding, as a team, that your job is now performance explanation rather than data assembly.
The other thing I would flag for 2026 is the integration of natural language query interfaces with automated reporting pipelines. The ability for a non-finance executive to ask a plain-English question and receive a governed, data-backed answer in seconds is no longer theoretical. Finance teams that have clean data and a complete automation pipeline are positioned to offer that capability. Teams still wrestling with spreadsheet versions are not.
Automation is not the destination. It is the foundation that makes everything else possible.
— Aaron
How Ailedger helps you put this into practice
Finance teams that want to move from manual assembly to governed, automated reporting need a platform that handles the full pipeline without requiring a developer for every change.
Ailedger connects your source systems, lets your finance team configure business rules independently, and generates formatted, audit-ready reports automatically. Distribution runs across email, dashboards, and communication channels with full access controls and version history. Whether you are a mid-sized firm building your first automated pipeline or a larger practice looking to tighten governance, the Ailedger Pro platform is built for exactly that transition. Use the Ailedger Finder to identify which reporting tools fit your current setup and reporting requirements.
FAQ
What is automated financial reporting in simple terms?
Automated financial reporting is software that collects data from your financial systems, applies your business rules, and produces formatted reports without anyone manually exporting or assembling the data.
How does automated reporting differ from a live dashboard?
A dashboard visualises data but typically requires a manual trigger or refresh. Automated reporting runs the full pipeline, including formatted report generation and distribution, on a defined schedule without human input.
What are the main benefits of automated financial reporting?
The primary benefits are a 35–46% reduction in process costs, up to 40% of finance working time reclaimed, improved data accuracy, faster close cycles, and real-time visibility for decision-makers.
What should finance teams do before automating their reports?
Finance teams should standardise their Master Data Management first, including chart of accounts, cost centre naming, and entity hierarchy, to prevent data quality issues from scaling across automated outputs.
Is automated financial reporting suitable for mid-sized businesses?
Mid-sized companies with 50–500 employees benefit significantly from automation, as it allows them to reach enterprise-level reporting quality without expanding their finance headcount.