Accounting automation ROI is the percentage return your business earns from automating financial processes, calculated by dividing net savings by total investment cost. It is not a soft measure of "time saved." It is a hard financial metric that sits alongside payback period and working capital impact on a CFO's desk. Finance teams evaluating automation projects in 2026 need this number to secure budget approval, set realistic expectations, and track whether the technology is actually delivering.
The core components that build ROI are:
- Labour cost savings from eliminating manual data entry, PO matching, and exception chasing
- Error cost avoidance covering duplicate payments, late fees, and missed early payment discounts
- Faster processing cycles that compress invoice approval times and accelerate month-end close
- Improved cash flow through better payment timing and discount capture
- Compliance and audit cost reductions from cleaner documentation trails
Tools such as Corpay Mastercard and Corpay Complete contribute to this picture by automating payments and expense management, reducing the manual touchpoints that inflate processing costs. A company processing 1,000 invoices monthly can expect roughly $1.08 saved per invoice through reduced labour, fewer errors, and faster approvals. That equates to about $12,960 in direct annual cost savings at this volume, according to industry benchmarks.
What actually drives accounting automation ROI?
ROI magnitude varies across organisations. The same platform can deliver very high returns for some finance teams and modest results for others., and the gap usually comes down to a handful of controllable factors.
Transaction volume and complexity sit at the top. High-volume, rules-based processes like accounts payable, bank reconciliation, and recurring journal entries produce the fastest and most predictable returns through intelligent automation platforms like Amaya AI's finance assistant. The more invoices you process, the larger the absolute saving from that per-invoice efficiency gain. A team handling more invoices monthly typically sees proportionally larger direct cost benefits than one handling fewer.

Labour cost calculations need to use fully loaded figures. A finance professional on a £55,000 salary may cost £75,000–£80,000 once employer National Insurance, pension contributions, and overhead allocation are included. Using salary alone understates the ROI case and leads to underinvestment in automation scope.
User adoption is where most implementations quietly fail. Automation integrated into existing workflows, with proper change management and training, generally outperforms standalone tools that staff work around. The finance automation change management dimension is not a soft HR concern. It is a direct ROI lever.
Other key drivers include:
- Early payment discount capture: Corpay Complete and similar platforms accelerate approval cycles, making 2/10 net 30 terms achievable where they previously were not
- Vendor relationship quality: consistent, on-time payments reduce supplier escalations and the hidden cost of managing payment disputes
- Error reduction: automated workflows cut error rates by around 78%, removing the downstream cost of finding and fixing mistakes
- Fraud prevention: payment controls built into automation platforms reduce exposure to invoice fraud, a common risk for many organisations.
How to calculate your accounting automation ROI step by step
The formula is straightforward. Execution is where finance teams often cut corners.
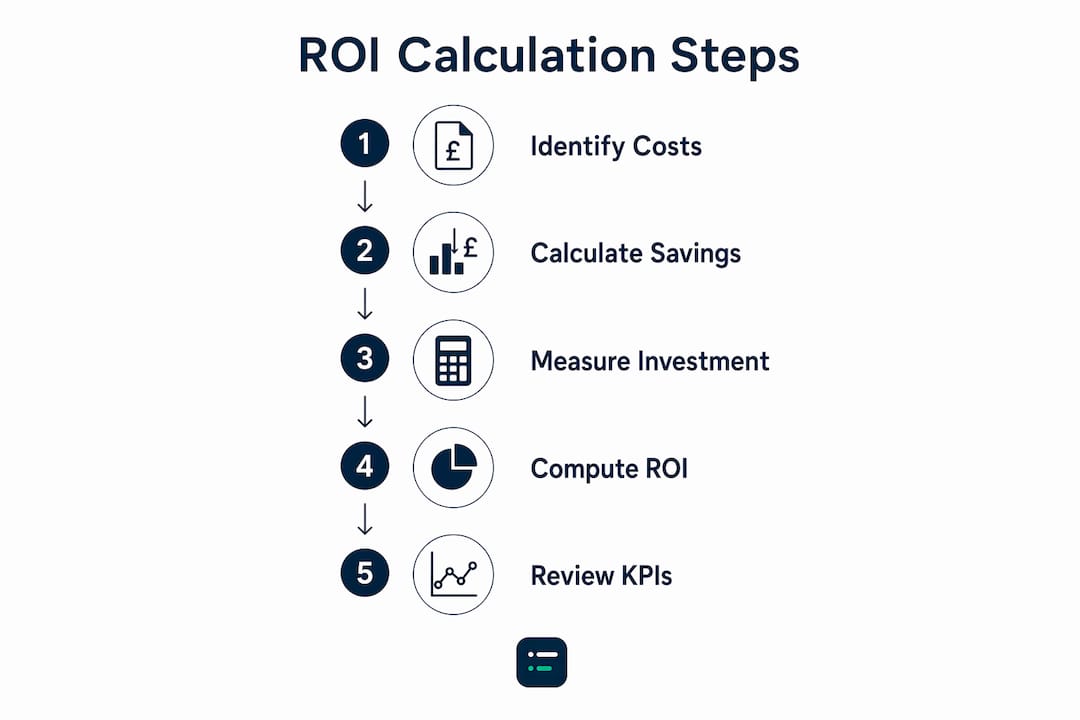
ROI (%) = (Net Savings ÷ Total Investment) × 100
Where: Net Savings = Total Annual Benefits − Total Annual Costs
Follow these steps to build a credible calculation:
-
Collect baseline data. Before touching any software, document your current state: headcount hours spent on AP, reconciliation, and close; cost per invoice (labour plus overhead); error rates and average cost per error; invoice cycle time; and early payment discount capture rate. Accurate baseline data is the single most important input. Guesswork here destroys credibility with stakeholders.
-
Identify all benefit categories. Break benefits into three tiers: direct (labour hours saved, error costs avoided, discounts captured), operational (faster close, fewer supplier escalations, reduced audit prep time), and strategic (finance staff redirected to FP&A and forecasting). Translate every tier into pounds where possible.
-
Calculate fully loaded labour savings. Multiply hours saved by the fully loaded hourly cost of the relevant staff. If automation removes 15 hours per week of AP processing at a fully loaded cost of £35 per hour, that is £27,300 annually before any other benefit.
-
Quantify error cost avoidance. Estimate your current monthly error volume and average cost per error. A team processing 1,000 invoices at a 2% error rate generates 20 errors monthly. At an average correction cost of £400 per error, that is £96,000 annually in avoidable waste.
-
Add early payment discount value. Calculate the annual payables volume where vendors offer early payment terms, multiply by the discount percentage, and apply your current capture rate versus a post-automation target rate.
-
Total all investment costs. Include software licensing, implementation fees, integration work (connecting to your ERP or accounting platform), data migration, training, and ongoing support. Do not use the subscription price alone. The total cost of ownership is often 1.5–2x the licence fee in year one.
-
Run the formula. Divide net savings by total investment and multiply by 100. A result above 100% means you have recovered your investment and generated a surplus.
-
Set a payback period target. Divide total investment by monthly net benefit. Most well-scoped implementations reach break-even within 12–18 months, with initial returns visible within the first 3–6 months.
-
Track ongoing. ROI is not a one-time calculation. Commit to measuring the same metrics quarterly so you can demonstrate sustained value and identify where gains are eroding.
Which KPIs should you track to validate AP automation ROI?
Finance teams using structured KPI frameworks achieve 2.3x higher ROI than those relying on default vendor dashboards. The reason is simple: vendor dashboards report activity. CFOs care about financial outcomes.

Accounting automation implementations generally achieve strong ROI over a two-year period, with top performers outperforming the average significantly. Hitting those numbers requires tracking the right signals from day one.
| KPI | Definition | Financial relevance |
|---|---|---|
| Cost per invoice | Total AP operating cost divided by invoice volume | Direct SG&A line item; every £1 reduction drops to operating income |
| Exception rate | Percentage of invoices requiring manual intervention | Leading indicator of future SG&A trajectory |
| Invoice cycle time | Average days from receipt to payment approval | Determines early payment discount capture and cash outflow predictability |
| Days Payable Outstanding (DPO) | Average days taken to pay suppliers | Balance sheet metric affecting working capital and free cash flow |
| Early payment discount capture rate | Percentage of available discounts actually taken | Direct income statement impact; measurable in pounds per year |
| Duplicate payment rate | Percentage of payments made more than once | Non-operating loss or SG&A variance requiring board explanation |
| Forecast accuracy (MAPE/WAPE) | Variance between predicted and actual cash outflows | Determines buffer cash requirements and borrowing costs |
| Touchless processing rate | Percentage of invoices processed without human intervention | Proxy for automation maturity and future headcount planning |
Best practices for KPI tracking:
- Lock baselines before go-live. Every KPI needs a pre-automation benchmark. Without it, improvement claims are unverifiable.
- Group metrics by financial statement. Income statement (cost per invoice, exception rate, discount capture), balance sheet (DPO), and cash flow (forecast accuracy). This is the language your CFO thinks in.
- Track by cohort. Segment by business unit, supplier tier, or invoice type so implementation noise does not mask genuine improvement.
- Review on a 30/60/90 cadence. Expect adoption and quality metrics to move in weeks 2–4, operational gains by weeks 6–8, and credible financial impact by weeks 10–12.
Benefits of accounting automation that go beyond the numbers
The quantifiable ROI case is compelling on its own. The broader organisational benefits compound it.
Cash flow management improves materially. When invoice cycle times drop from 17 days to 3, the CFO can see the full payment queue with two weeks of lead time. That predictability reduces the need for precautionary cash buffers, which at a 7% cost of capital represents real annual savings on financing costs.
Compliance and audit readiness strengthen automatically. Automated workflows generate complete, timestamped audit trails without any additional effort from the finance team. Automated financial reporting reduces the time spent on audit preparation and lowers the risk of findings that carry regulatory or reputational cost.
Additional strategic benefits include:
- Vendor relationships: consistent, on-time payments build supplier goodwill and can unlock preferential terms over time
- Employee satisfaction: removing repetitive data entry from finance roles reduces burnout and improves retention, particularly relevant in a tight UK labour market
- Scalability: a team that processes 500 invoices manually needs proportionally more headcount at 1,000. An automated team handles the growth without additional hiring
- Decision-making quality: when finance staff stop spending energy validating the basics, they start trusting the data that reaches their desk and can redirect attention to forecasting and business partnering
- Resilience: automated processes are less vulnerable to staff absence, turnover, or the knowledge concentration risk that comes with manual, person-dependent workflows
How mature finance teams measure automation ROI strategically
Most finance teams measure automation badly. They report hours saved, invoices processed, and cost-per-invoice trends. The CFO asks what it means for working capital and gets silence. The report dies in a folder.
Mature finance teams avoid creating new automation KPIs entirely. Instead, they measure automation's impact on the financial process metrics that already exist: days-to-close, DPO, forecast accuracy, and SG&A. The question shifts from "what have we automated?" to "what has changed in the quality of our work?" That reframe is what separates a 287% ROI from a mediocre one.
A layered KPI approach structures this well: start with adoption (is the system actually being used?), advance to throughput (is work flowing faster?), confirm quality and controls (can you defend it to audit?), then quantify financial outcomes. Each layer builds the evidence base for the next.
Key strategic principles:
- Link every metric to a financial statement line. "We reduced AP operating costs from £114,000 to £42,000 annually" hits harder than "we cut cost per invoice by 65%." Both are true; only one survives a board presentation.
- Avoid volume metrics as ROI proof. Counting automations created or processes "100% automated" pushes teams to automate what is easy, not what is relevant.
- Treat automation as a structural capability, not a project. The best implementations have no defined end. They track improvements in work quality and predictability continuously.
- Hyperautomation extends the ROI ceiling. Hyperautomation in finance moves beyond task automation by integrating intelligence and adaptability across systems, enabling predictive exception handling and risk anticipation rather than just faster processing of known workflows.
Pro Tip: When preparing your quarterly automation ROI report for the CFO, structure it in three sections aligned to financial statements: income statement impact (cost per invoice, exception rate, discount capture), balance sheet impact (DPO movement), and cash flow impact (forecast accuracy improvement). Attach a single headline figure: "Automation contributed £X to operating income this quarter." That framing gets funded.
Real-world ROI outcomes in UK businesses
UK finance teams implementing accounts payable automation report outcomes consistent with the broader benchmarks, though the specifics vary by organisation size and scope.
A mid-sized UK manufacturer processing around 2,000 invoices monthly that automates its AP function typically sees cost per invoice fall from the manual average of approximately $5.29 to around $4.21, the equivalent of roughly £0.85 per invoice at current exchange rates, based on the per-invoice savings analysis across 500+ implementations. At that volume, direct annual savings are approximately $12,960 before accounting for error avoidance or discount capture.
Month-end close is where the time savings become most visible. Finance teams that fully automate reconciliations and journal entry processing report close time reductions of around 35%. For a team running a 10-day close, that is 3.5 days returned to analysis and reporting rather than manual verification. In practice, that capacity often gets redirected to the FP&A work that was previously squeezed into whatever time remained after close.
Forrester's Total Economic Impact framework modelled a global enterprise implementing modern AP automation and found an ROI of 111% with payback in under six months. That is a conservative benchmark relative to the 287% average seen across broader implementation data, but it reflects a shorter measurement window and a larger, more complex organisation where integration costs are higher. UK businesses with tighter ERP environments and cleaner data tend to see faster payback.
The pattern across UK implementations is consistent: organisations that start with high-volume, rules-based processes, achieve strong user adoption, and track KPIs tied to financial statements reach full ROI within 12–18 months. Those that deploy automation without baseline data or clear KPI ownership rarely validate the return at all.
Automation vs. manual processes: where the ROI gap actually comes from
The financial case for automation over manual processing is not primarily about speed. It is about compounding error costs, hidden labour, and the opportunity cost of finance staff doing work that adds no analytical value.
Manual AP processing costs approximately $5.29 per invoice against $4.21 for automated processing, a gap of $1.08 per invoice. That direct cost difference is the visible part. The larger gap sits in what manual processing prevents your team from doing. When finance staff spend their time on data entry, exception chasing, and payment status calls, they are not building forecasts, analysing variances, or supporting commercial decisions.
| Dimension | Manual processing | Automated processing |
|---|---|---|
| Cost per invoice | ~$5.29 | ~$4.21 |
| Error rate | Baseline | Reduced by ~78% |
| Month-end close time | Baseline | Reduced by ~35% |
| Early payment discount capture | Limited by cycle time | Achievable with 3-day cycles |
| Fraud exposure | Higher (manual controls) | Lower (automated policy enforcement) |
| Scalability | Linear headcount growth | Volume growth without proportional hiring |
| Audit trail quality | Inconsistent, manual | Complete, timestamped, automatic |
The role of AI in financial operations extends this gap further. Intelligent automation does not just process invoices faster. It flags anomalies, learns from exceptions, and connects data across systems in ways that manual workflows structurally cannot. That is where the top-quartile 400%+ ROI implementations separate from the median.
One practical point worth noting: the ROI gap between automation and manual processing widens over time, not just because savings accumulate, but because manual processes tend to degrade as volume grows. Errors compound, exceptions multiply, and the cost of maintaining manual controls rises. Automation, by contrast, tends to improve as the system learns and adoption deepens.
Key takeaways
Accounting automation ROI averages 287% over 24 months when finance teams track structured KPIs tied to financial statements, start with high-volume processes, and treat automation as an ongoing capability rather than a one-time project.
| Point | Details |
|---|---|
| ROI formula | Net Savings ÷ Total Investment × 100; use fully loaded labour costs, not salary alone. |
| Benchmark ROI | The average 24-month return is 287%; top-quartile implementations exceed 400%. |
| KPI selection | Track 8 metrics across cost, accuracy, cycle time, and cash impact; link each to a financial statement line. |
| Baseline data | Collect pre-automation headcount time, error rates, and cycle times before go-live; without them, ROI claims are unverifiable. |
| Automation vs. manual | Automated AP costs approximately $4.21 per invoice compared to $5.29 for manual processing, creating a direct cost saving of $1.08 per invoice. |
Find the right automation tools for your practice
Knowing the ROI framework is one thing. Finding the tools that actually deliver it for your practice size, software stack, and workflow is another. Ailedger's free directory covers 45+ AI accounting tools, with side-by-side comparisons across tasks like invoice processing, reconciliation, and month-end close. You can compare automation tools by task and platform in about 30 seconds, or browse the full directory at ailedger.uk to find what fits your practice.